We have had increasing concerns about the accuracy and independence of information distributed by the SYMVCD to support their planned spray campaign. In particular, we supplied a critique of the claimed efficacy of the 2005 aerial spraying of Sacramento. We are particularly chagrined by the apparent crop-duster mentality of the officials of this highly autonomous body, and we have lamented the failure to implement very effective biological controls for mosquitoes, which present no risk to either human health or the environment, and some of which are being successfully implemented in third-world countries.
Mosquito Counts Drop Dramatically Before Spraying. Our concerns were heightened when on the weekend prior to August 8 infected-mosquito counts went down to zero and total-mosquito counts had dropped precipitously by 92% since the week of July 16, yet the District Manager was quoted as saying that the spray decision was a difficult one and sprayed Davis and Woodland anyway. It had seemed clear that officials had been determined to spray Davis no matter what and that SYMVCD had been ignoring science up to that point. At that time the previously highly touted numbers and facts went into the trash can in addition, with the low figures having been dismissed as “an anomaly.” Will the figures be dismissed as an anomaly and the planes grounded if they take a large upward spike?
Junk Science. There has been a dearth of peer-reviewed publications and independently verified analyses throughout this controversy. Certainly what has been provided by SYMVCD can best be called junk science, if it can be called science at all. It is particularly troubling to watch scientists at UC Davis, an institution that has some excellent scientists on the staff, sit in silence as this junk science is used to promulgate very questionable, and potentially harmful, public policy.
We thought we had seen it all, however, until we saw a slick report by the District Manager posted on the CDC website. The discerning reader can see this for her/himself, but we must point out a few things.
SYMVCD REPORT ON CDC WEB SITE:
• Incorrect Population Figure. On page 2 the population of Yolo County is listed as 400,000, whereas the U.S. Census Bureau lists its 2005 estimate as 184,932. What is to be gained by exaggerating this figure so badly?
• What Really Happened At Town Hall Meeting. On page 19 the report shows a clip from the Sacramento Bee that says “W. Nile forum fray is faulted” and “The disrupted meeting was a lost chance to inform Davis residents, official says,” referring to a town hall meeting in Davis on August 23, 2005. For an excellent discussion of what really happened at the meeting in Davis, see this article by Shawnee Hoover of Beyond Pesticides. In fact, there was more genuine expertise in the audience than on the panel at that meeting, and the participants held a very informative and productive meeting after panel members decided to leave instead of answering questions from the audience. These knowledgeable Davis residents did indeed object to “being informed” in a way such as this report “informs.” One participant observed at meeting end that “a little democracy broke out here tonight.”
• Concerned Citizens Depicted As Rioters. On page 20 the report illustrates protests at town-hall meetings with a picture of rioters throwing rocks. As far as we know, that kind of behavior is beyond the pale relative to this controversy, and it is a gross exaggeration of what happened at the August 23 meeting in Davis, for example, with participants remaining civil throughout and members of the audience conducting an informative meeting after officials walked out.
• Fictional Representation. On the next page the report makes a claim of overall acceptance and illustrates it with a picture of a standing ovation. While there are people who assume that the risks from WNV are large, that adulticiding is effective at combating the claimed risks, and who thus agree with the spraying, we know of no cases in which policy statements or officials have been greeted with this kind of approval.
• False Claim. On page 23, the report makes the patently false claim of the “elimination of WNV infection.”
• Misleading Graphs and Questionable Statistic. On page 28, where graphics depict the West Nile cases by weekly samples north and south of the American River, the lumping of the samples into weekly segments makes the exact impact of the spray on the presentation of symptomatic disease more difficult to discern. Another obfuscating aspect of this graphic is the inclusion of asymptomatic blood donors as well as symptomatic cases without known onset date in the timeline along with those cases where the onset date was known. Mixing the dates of blood sample determinations in the timeline with dates of expression of symptomatic disease is something of mixing apples and oranges.
• No Clear Impact of Spray. Even with that questionable statistic the graphs don’t show any decided impact from the spray, particularly in the southern zone. The southern graph shows the coincidence of the declining infection rate in advance of the spray much more markedly than the northern zone. Because the virus has an incubation of 3-14 days before expression of symptoms, the first observable impact of the spray on the symptomatic case data would be three days after the spray. In this case the first observable impact from a spray from August 20th through 22nd would be in the sample week ending August 27th but instead there is a nearly 50% decline in the rate during the week ending August 20th in advance of the spray’s potential effects. The decline after the spray was much less, 20%.
• Case Rigged Against “Control” Areas. In the section beginning on page 29, authored by Ryan Carney, there are a number of confusing and contradictory stipulations. First, it describes the incidence of cases of West Nile Virus in the “control” regions and treatment regions as being similar. It asserts that “control” regions were selected according to the premise that a similar number of cases of the disease had occurred prior to the spray as in the treatment region. The number of cases listed for the treatment region prior to spray is 45 while 33 are listed in the “control” area prior to spray. Since the treatment area had two and one-half times the population of the “control” region these are not comparable numbers. Proportionate to population the “control” region had nearly a 90% higher rate of infection prior to the spray.
• Numbers Are Not Compatible. The map presented on page 31 differs from the spray map presented on page 19. Exactly which areas of Sacramento County were treated and which were not, and of those which are in the “control” regions listed in the study, is somewhat unclear. The whole issue of controls in an analysis of this spray treatment implies a controlled test of hypothesis, which Mr. Goodman, who was in charge of the spray operations, assures us, did not take place. He stipulates that the only regions that were not treated did not meet the criteria for treatment, ergo there were no human cases known to vector control in those regions when decisions about the spray were made. In fact at the time of the spray on August 11th there were only 36 cases known to the health officials. Retrospectively the state Health Services cites 97 cases at that time.
• Outrageous Unsourced Quote. On page 37 the third item is an outrageous quote from an unnamed source, i.e. that the “Disease affects only those over 50 . . . . they do not reproduce nor are they long for the world anyway.” Certainly no responsible critic of SYMVCD’s very questionable policies would make such a statement, and we know of no statement made by anybody that comes even close. Why is the supposed source not quoted? Is this a manufactured statement? Is it an attempt to discredit opponents with fiction by painting them as uncaring?
• Unscientific Data Gathering. The whole problem of how this data was gathered is one of the refutations to any scientific credibility for the “study”. The Health Services have relied on the health-care seeking behavior of those infected with a cryptic virus as their means of monitoring infection rates. Most of these cases weren’t diagnosed and entered into the Health Services list for more than two weeks after the physician-stipulated date of onset of symptoms. Many were as much as two months after the listed onset date. This timeline is based upon the recollections of the patients. This lack of exactitude for time considerations makes this time-specific analysis suspect. The remarkable inefficiency of sampling for WNV in this manner, approximately 3%, adds to the suspicions. A scientific assessment of this question would have taken serological samples from randomly selected Sacramento residents at regular time intervals to measure these questions.
• Cases Still Missing. And once again this DHS study does not account for all 154 symptomatic cases with a known onset date. There are only 110 of the 154 cases in the table. The other 44 would surely lend consequential information about the timeline of the “epidemic” and should be included in the analysis. When asked about this Health Services officials responded first that several of the cases had no known onset date; second that the number of cases had no identified residential address; and third that there were regions of Sacramento County not included. There was no precision as to how many cases had no address or were transients or how many were in areas that were too rural to compare. The assertion that several of these had no known onset date is specious since they come from the pool of cases with a known onset date. That they were transients or homeless would probably have them sleeping outdoors in well-known areas that were under the spray. That these were cases in unsprayed areas where the population density was less than the treatment makes us wonder why the Health Services didn’t wish to evaluate the extent of what is principally a rural phenomenon.
• No Landscape Epidemiology. Most significantly this study fails to assess the location of transmission for any of the cases. Instead it assumes that the residential address can serve as a marker for the site of transmission. The assumption is nothing like scientifically legitimate. It could only apply in a circumstance where the expected distributions are either entirely uniform or entirely random. In fact the sampling problem is very much akin to the Poisson statistic where most sample points will exhibit zero with the non-zero returns being relatively few. The distribution will be far from uniform but will be instead punctuated by certain foci from which there will be a diminishing gradient of transmission at greater radii from the focus. These vectors (mathematical) will not be uniform in magnitude in all directions but will be highly directional according to the topography, prevailing wind currents and patterns of dispersal for the mosquitoes, birds and people. None of these elements is random; hence each really must be measured and considered rather than making assumptions of uniformity. Quite literally the Health Services would be equally correct in assuming all cases were acquired on Mars, or that the 44 unaccounted were Martian tourists who returned home before the Health Services got around to wondering where they lived or if they lived or died!
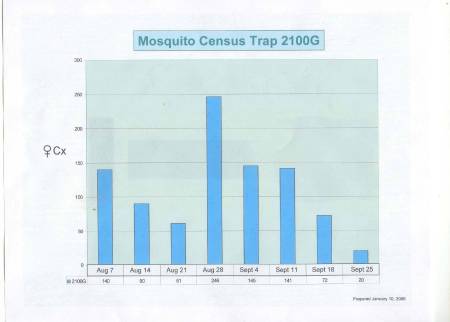
• What Is Really Going On? The primary emphasis of this report is on mosquito counts. The hypothesis is that the drop in the counts that SYMVCD exhibits comes from mosquito-control activity. But, there wasn’t any real drop in the mosquito populations until the first week of September when irrigation agriculture was ceasing for the season. The symptomatic expression of human cases of WNV has a timeline that peaks on August 1. There isn’t as direct a relationship between mosquito abundance and the transmission of this disease as SYMVCD officials apparently want people to think. The real issue is the abundance of the virus in the birds in conjunction with the mosquitoes. There clearly wasn’t a direct relationship between mosquito abundance and the transmission of the virus in the month of August in Sacramento, since the transmission declined while mosquito counts increased. The missing element is the peak virus rate in the birds, which had to be mid July. After this, transmission to people declined irrespective of spray.
After seeing this nearly unbelievable report, appearing on its website and thus officially sanctioned by the CDC, one of our members commented that SYMVCD’s sense of peer review seems to be to “circulate the ‘findings’ to all colleagues already in agreement.” We can only ask if the case for spraying adulticides is so poor that officials must resort to this sort of desperate attempt to justify it. After seeing SYMVCD’s reports so consistently flawed in fundamental ways, we believe that little question can remain about this.